
It’s easy to debug and experiment with JavaScript code in a web browser, yet difficult to debug JavaScript in FileMaker. Here’s a workaround.
JavaScript
Utilizing JavaScript in your FileMaker solution can open up an array of new possibilities for design and functionality. With a little bit (or a lot!) of HTML, CSS, and JavaScript, you can access design frameworks like Bootstrap, or integrate different charting features using one of the many JavaScript-based chart libraries available.
JavaScript is a favorite among web developers, as most web browsers have built-in tools for debugging and experimenting with code. By right-clicking in the browser window, you can select the “Inspect,” or “Inspect Element” option to open developer tools in a side panel.
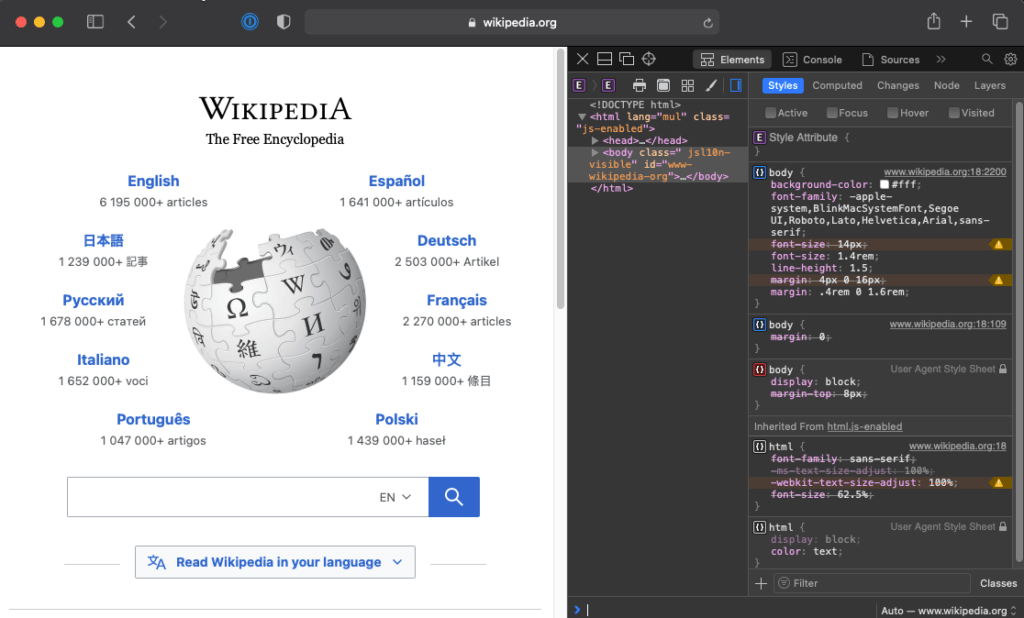
Safari Development Tools
Debugging custom HTML, CSS, and JavaScript in FileMaker, however, is a little trickier. Since everything in FileMaker is routed through a text field, you don’t get the built-in debugging tools of either a browser or an IDE, so you have to write your code elsewhere and copy/paste it into your solution when it’s ready. When you want to make changes, you have to jump back and forth between your IDE and your solution, going through too many steps to test small changes.
It is possible, however, to enable developer tools for web viewers in FileMaker, but it’s sort of a hidden feature, and requires that you’re on MacOS since FileMaker uses the same developer tools as Safari.
Here’s how to show web development tools in FileMaker:
- Make sure to quit FileMaker completely
- Open the terminal and type or copy/paste the following command in a single line. Note: .pro12 is the correct parameter for FileMaker 19:
defaults write com.filemaker.client.pro12
 WebKitDebugDeveloperExtrasEnabled -bool YES
3. Test it out!
Right click on the web viewer and you should see at least two options: “Reload” and “Inspect”. Click “Inspect” and the developer tools will open in a separate window. If it opens as a panel, you can pop it out using the button in the top left corner for easier viewing.
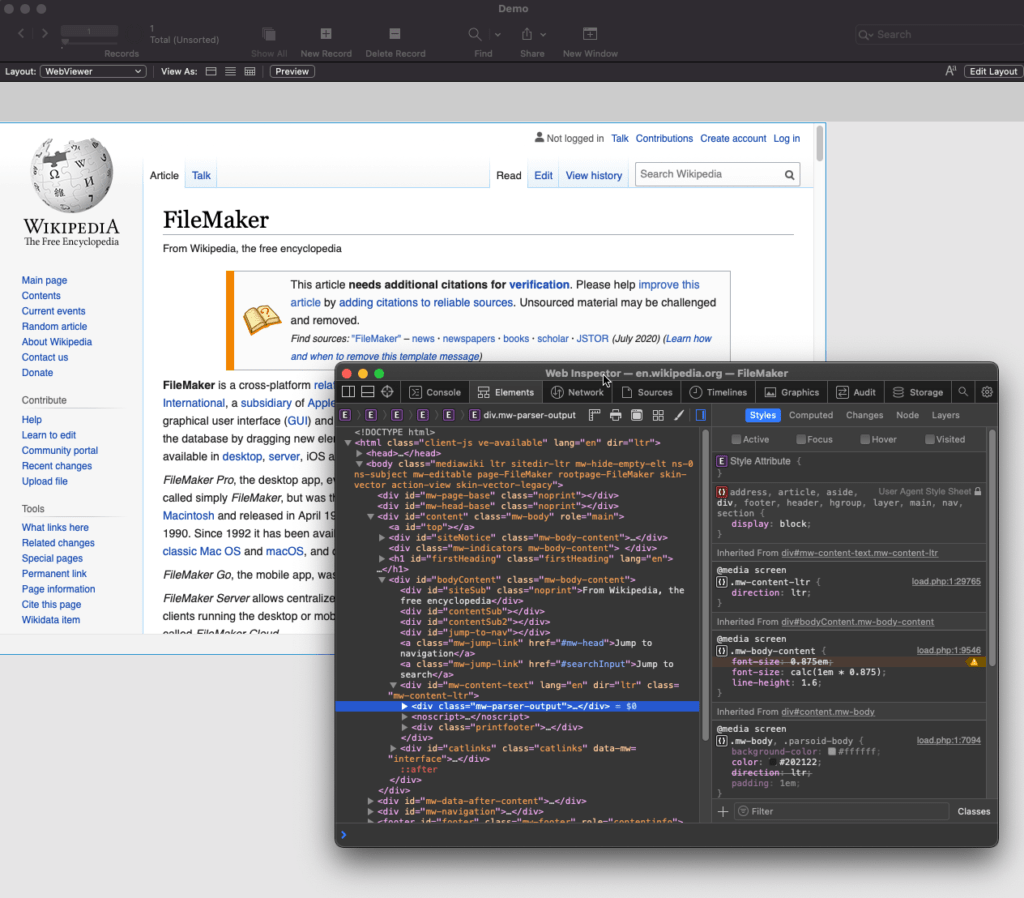
Development Tools in FileMaker
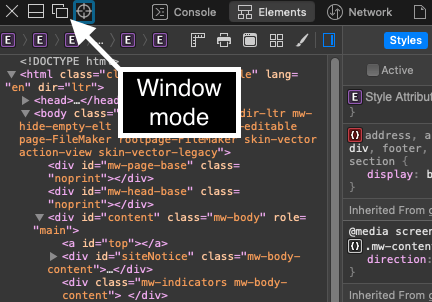
Development Tools in Window Mode
There are a few caveats:
- This only works in browse mode
- Be sure that the “Allow interaction with web viewer content” option is enabled in the web viewer setup
- If you navigate away from the web viewer you’re inspecting, the inspector window will close. To mitigate this, it’s a good idea to include debugging steps in your code, such as console.log(), or console.table(). W3schools has a simple intro to debugging, or check out this more advanced guide from Raygun
*This article was originally written for AppWorks, which has since joined Direct Impact Solutions. This article is intended for informative purposes only. To the best of our knowledge, this information is accurate as of the date of publication.